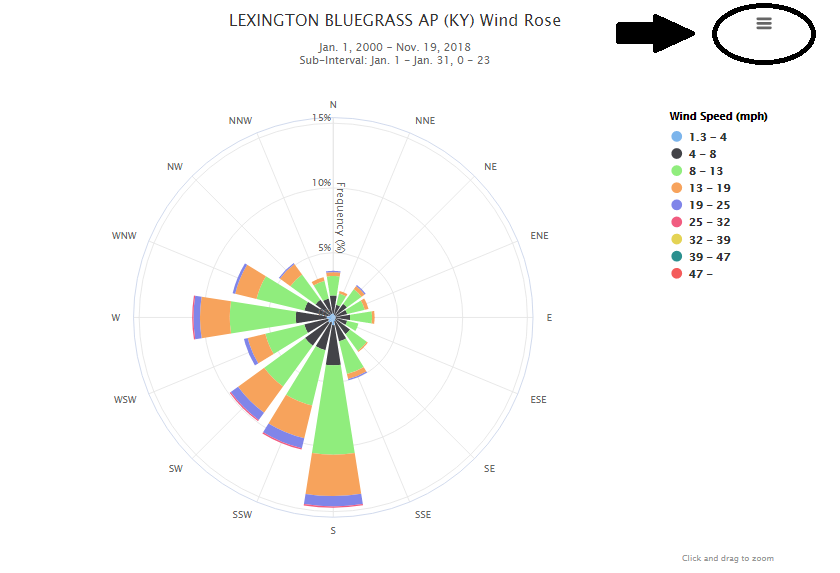
The development of a wind rose requires a large amount of data. This is the case due to the requirement of station data that collects on an hourly basis. The majority of this information is retrieved at airports across the state and can be accessed through a number of applications. Recently, the Midwestern Regional Climate Center (MRCC) developed a simple tool to extract this data and generate a wind rose for any hourly station across the United States. Below you will find a step by step process in the development of a wind rose for your area, using the Midwestern Regional Center's tool kit.
Step 1 - Registration
Start out by navigating to the Midwestern Regional Climate Center's (MRCC) Application Tools Environment (cli-MATE), found at
https://mrcc.illinois.edu/CLIMATE/. This tool kit gives
a user access to a tremendous amount of climate data for various locations across the United States. This program is
free to use, but does require a user registration, accessed within the orange box on the right side of the screen.
Fill out and submit the registration form.

Upon registration, you will be navigated back to the cli-MATE home screen where you will then login into the system with your email and password.

Step 2 - Selecting Hourly Station
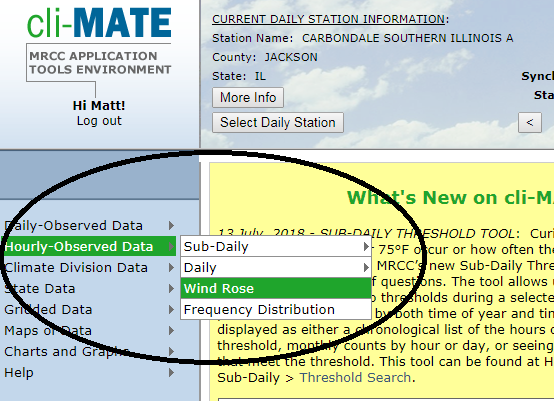
After logging into the system, hover your mouse over 'Hourly-Observed Data' within the blue box on the left
hand side of the screen. Then select 'Wind Rose'.
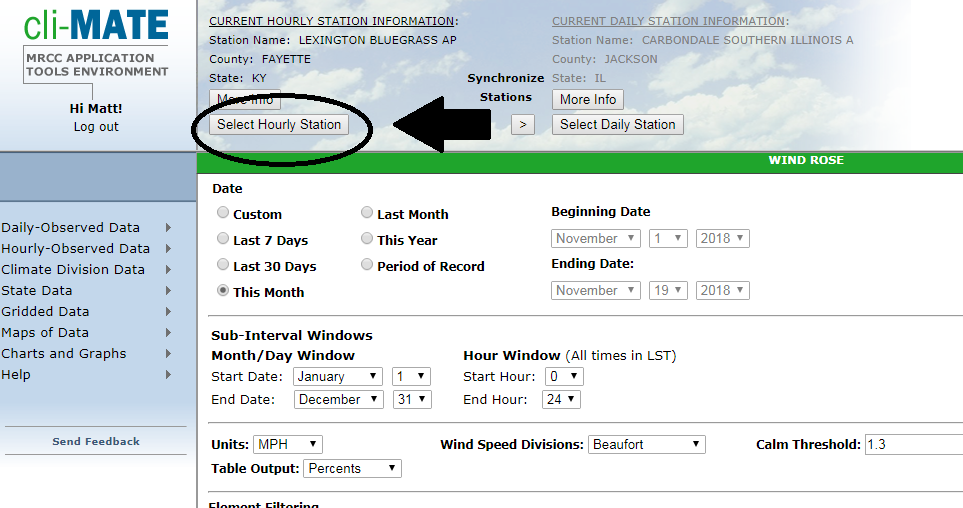
You'll then notice some information at the top of the screen denoting 'Current Hourly Station Information'. Use the link just below to select hourly station.
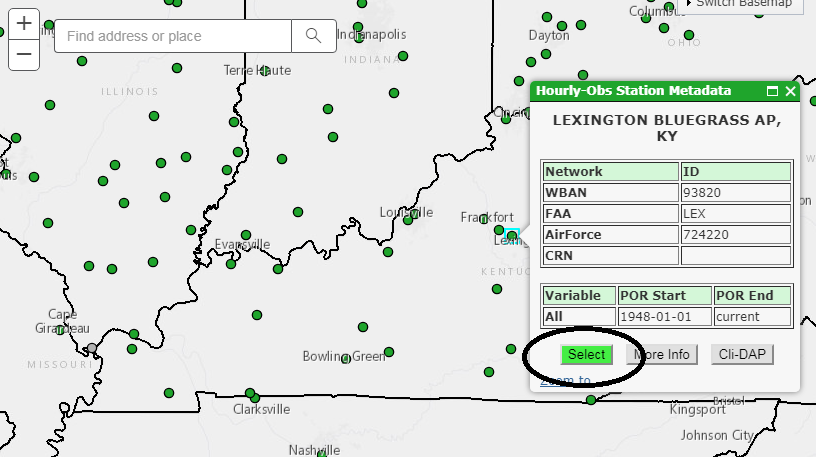
The MRCC allows a user to select a station a few different ways. It is recommended to use the map selector to quickly find a station nearby the area of interest.
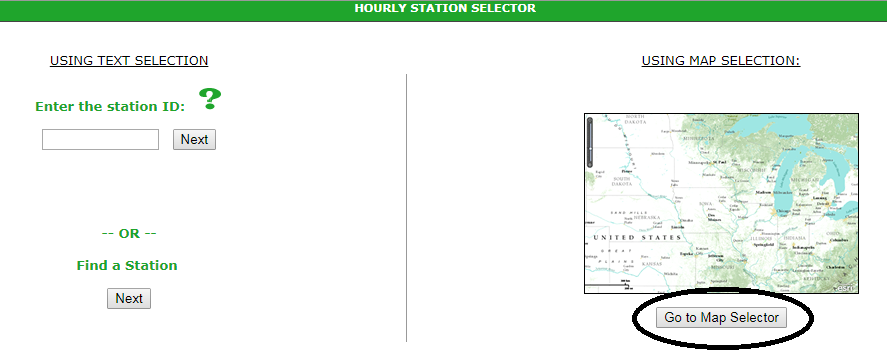
Hourly stations are not nearly as common across the area as is daily. Select a green dot that is closest to your area of interest. Upon clicking the site, you will get a look at the station characteristics, including it's identification and availability (start and end dates). In the extension publication, we only used sites that contained at least thirty years of data. If interested, there are other available sites across Kentucky, but with shorter spans of availability. As an example, Somerset Pulaski Airport has data available starting in December of 2005. After clicking the station of interest, click the 'Select' button and then confirm your selection on the proceeding page by clicking 'Go'.
Step 3 - Creating Wind Rose
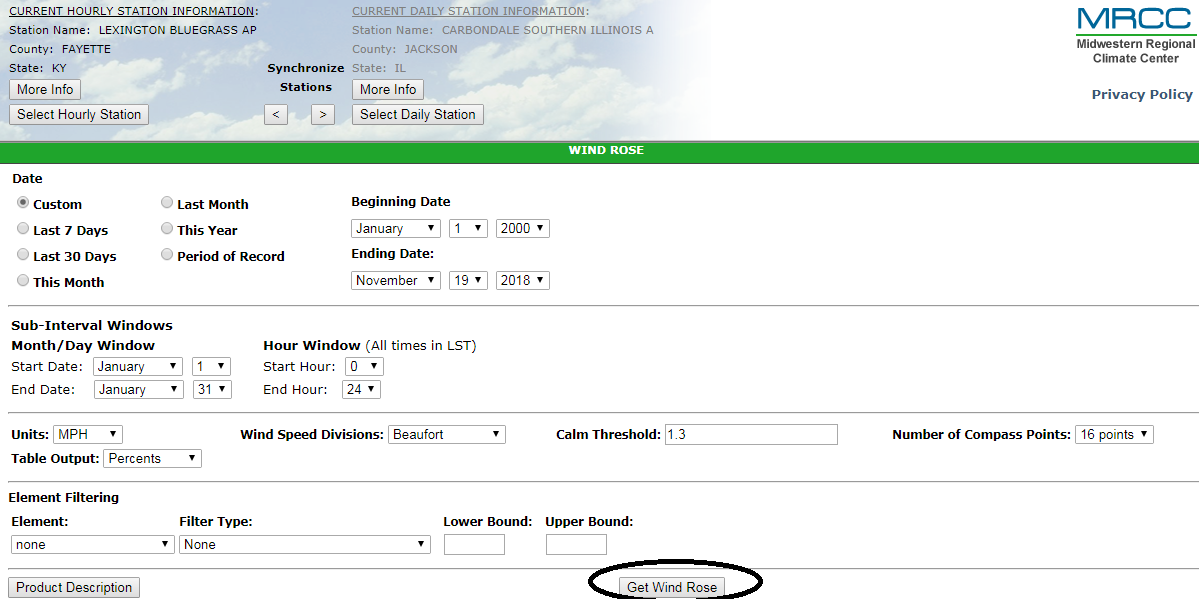
After clicking 'Go', you'll be taken back to the page for generating a wind rose. You should now see your
selected station at the top of the page under 'Current Hourly Station Information'.
The first two sections of the tool
specify the time periods for data analysis. When generating a wind rose, typically 30 years of data is
used, but that will vary based upon data availability. The second section allows the user to select a
sub-interval window. In this section, you can narrow down the data to a specific month, season, or even
day.
The following are a couple examples. If I was looking for a wind rose based on January data over the past
10 years, I would select 'Custom' in the first section, followed by putting in the beginning date of
January 1st, 2009 and ending date of January 31st, 2018. In the sub-interval window, I would then select
a start date of January 1 and end date of January 31.
In another example, I look to generate a wind rose based on annual data over the past full 10 years.
Once again, I'll select 'Custom', but this time select January 1, 2008 as a starting date and
December 31st, 2017 as an ending date. I would then just leave the sub-interval window as January 1st thru
December 31st to account for the entire year.
For simplification, the third and fourth sections can be left unchanged with the program's original
selections. Select 'Get Wind Rose' to generate. Depending on the amount of data being processed, this could
take a bit of time, but is typically generated in less than a minute.
Upon completion of your wind rose, you'll notice three horizontal lines to the right. Clicking on this feature will allow the user to either print the wind rose or download as a PNG, JPEG, PDF, or SVG.
Looking at the wind rose itself, it is important to keep in mind that we are looking at the direction from which the wind is predominantly coming from. In the example below, we can say the wind is predominantly coming from the south and in this case, nearly 15% of the time for the month of January during the period selected.
