
|
 The brunt of the rainfall fell over the first and last weeks of July, with below
normal rainfall in between. Looking at the period between the 4th and the 10th, the
Bluegrass State averaged 3.92 inches, which was nearly 3 inches above normal. This
much rainfall in a week had not been seen since May of 2010. Several rounds of
thunderstorms saturated Kentucky over the course of the period. A handful of
locations in Western Kentucky received 10 inches of rainfall for the week. One
Mesonet station in Benton, KY even saw an unbelievable 8 inches of rain in 6 hours!
Any storms that did develop were heavy-rain producers as the state remained
entrenched in a humid air mass for much of July. After a couple weeks of slightly
drier than normal conditions, showers returned to end the month. The last week
brought another lengthy period of extremely wet conditions as the state averaged 2.5
inches of rainfall, leading to some additional flash flooding. Overall, a large area
of Western and Central Kentucky saw 10 to 15+ inches for the month of July, which can
be seen in the image below.
The brunt of the rainfall fell over the first and last weeks of July, with below
normal rainfall in between. Looking at the period between the 4th and the 10th, the
Bluegrass State averaged 3.92 inches, which was nearly 3 inches above normal. This
much rainfall in a week had not been seen since May of 2010. Several rounds of
thunderstorms saturated Kentucky over the course of the period. A handful of
locations in Western Kentucky received 10 inches of rainfall for the week. One
Mesonet station in Benton, KY even saw an unbelievable 8 inches of rain in 6 hours!
Any storms that did develop were heavy-rain producers as the state remained
entrenched in a humid air mass for much of July. After a couple weeks of slightly
drier than normal conditions, showers returned to end the month. The last week
brought another lengthy period of extremely wet conditions as the state averaged 2.5
inches of rainfall, leading to some additional flash flooding. Overall, a large area
of Western and Central Kentucky saw 10 to 15+ inches for the month of July, which can
be seen in the image below.
 Looking at agriculture, the heavy rain at the start of the month left many low lying
fields in standing water and resulted in crop losses to tobacco, corn, and soybeans.
All of this was especially true in Western Kentucky. Dr. Chad Lee, UK Extension
Agronomist, took a closer look at flooded corn in an article found here and the chance of survival. Specialists at UK have also
mentioned that the extremely wet conditions and high humidity favored more disease
pressure. Below is a list of several links to various diseases that were spotted
in the month of July and related information from specialists in the College of
Agriculture, Food, and Environment.
Southern Rust of Corn
Tobacco Target Spot & Frogeye
Vegetables - Southern Blight
Northern Leaf Blight, Gray Leaf Spot, Common Rust, and Diplodia Leaf Streak
Tomato Spotted Wilt Virus
While the rainfall was the highlight of the month, extreme heat was another issue.
Temperatures remained above normal for each week of July. The most impactful period
was between the 18th and 24th, when the state saw a prolonged period of heat and
humidity. During the heat wave, high temperatures routinely rose into the upper 80s
to middle 90s, along with dew points hovering in the 70s. This repeatedly pushed heat
indices over 100, especially across Central and Western Kentucky. Multiple Heat
Advisories were issued across the Commonwealth, in addition to an Excessive Heat
Warning across Western Kentucky. Not much recovery was seen at night either as
temperatures and dew points remained elevated. This created stressful conditions for
livestock as the heat stress index rose into the danger to emergency category each
day. Dr. Lee also mentioned that much of the corn was at peak water demand at this
time. More information on water usage can be seen in his tweet below.
Looking at agriculture, the heavy rain at the start of the month left many low lying
fields in standing water and resulted in crop losses to tobacco, corn, and soybeans.
All of this was especially true in Western Kentucky. Dr. Chad Lee, UK Extension
Agronomist, took a closer look at flooded corn in an article found here and the chance of survival. Specialists at UK have also
mentioned that the extremely wet conditions and high humidity favored more disease
pressure. Below is a list of several links to various diseases that were spotted
in the month of July and related information from specialists in the College of
Agriculture, Food, and Environment.
Southern Rust of Corn
Tobacco Target Spot & Frogeye
Vegetables - Southern Blight
Northern Leaf Blight, Gray Leaf Spot, Common Rust, and Diplodia Leaf Streak
Tomato Spotted Wilt Virus
While the rainfall was the highlight of the month, extreme heat was another issue.
Temperatures remained above normal for each week of July. The most impactful period
was between the 18th and 24th, when the state saw a prolonged period of heat and
humidity. During the heat wave, high temperatures routinely rose into the upper 80s
to middle 90s, along with dew points hovering in the 70s. This repeatedly pushed heat
indices over 100, especially across Central and Western Kentucky. Multiple Heat
Advisories were issued across the Commonwealth, in addition to an Excessive Heat
Warning across Western Kentucky. Not much recovery was seen at night either as
temperatures and dew points remained elevated. This created stressful conditions for
livestock as the heat stress index rose into the danger to emergency category each
day. Dr. Lee also mentioned that much of the corn was at peak water demand at this
time. More information on water usage can be seen in his tweet below.
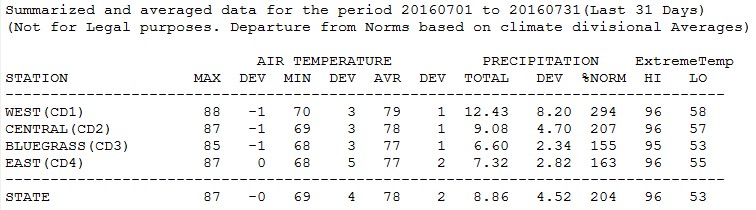
Temperatures for the period averaged 78 degrees across the state which was 2 degrees warmer than normal. High temperatures averaged from 88 in the West to 87 in the East. Departure from normal high temperatures ranged from 1 degree cooler than normal in the West to near normal in the East. Low temperatures averaged from 70 degrees in the West to 68 degrees in the East. Departure from normal low temperature ranged from 3 degrees warmer than normal in the West to 5 degrees warmer than normal in the East. The extreme high temperature for the period was 96 at KOOMER RIDGE and the extreme low was 53 at CYNTHIANA 8N. Precipitation (liq. equ.) for the period totaled 8.86 inches statewide which was 4.52 inches above normal and 204% of normal. Precipitation totals by climate division, West 12.43 inches, Central 9.08 inches, Bluegrass 6.60 inches and East 7.32 inches, which was 8.2, 4.7, 2.34 and 2.82 inches above normal. By station, precipitation totals ranged from a low of 3.30 inches at CARLISLE 5SW to a high of 18.26 inches at HOPKINSVILLE 6N. Summarized and averaged data for the period 20160701 to 20160731(Last 31 Days) (Not for Legal purposes. Departure from Norms based on climate divisional Averages) AIR TEMPERATURE PRECIPITATION ExtremeTemp STATION MAX DEV MIN DEV AVR DEV TOTAL DEV %NORM HI LO -------------------------------------------------------------------------------- WEST(CD1) 88 -1 70 3 79 1 12.43 8.20 294 96 58 CENTRAL(CD2) 87 -1 69 3 78 1 9.08 4.70 207 96 57 BLUEGRASS(CD3) 85 -1 68 3 77 1 6.60 2.34 155 95 53 EAST(CD4) 87 0 68 5 77 2 7.32 2.82 163 96 55 -------------------------------------------------------------------------------- STATE 87 -0 69 4 78 2 8.86 4.52 204 96 53 === Kentucky Climate Summary For the Period June 2016 Above Normal Temperatures and Below Normal Rainfall: * It was a difficult spring for many Kentucky agricultural producers. Weather was the main concern. June 2016 was exactly the opposite of the previous month; May was cool and wet for the most part, June was dry and warm. In fact, June 2016, was 12 degrees warmer than May 2016. While May was over an inch above normal rainfall, June had over one inch below normal. And while that may look to average out, the impact was a double whammy to agricultural producers. The cool, wet conditions of May 2016 slowed field activities in the from of getting crops planted but also emergence/development. Then a warm, dry June caused a biological explosion in Kentucky fields. By the third and final week of June crops were already starting to show some stress, expecially in western and west central sections of the Commonwealth. The west only received 61 per cent of normal monthly rainfall. The Bluegrass and Eastern climate sections faired much better than did the western half of the state for moisture but still was around a half of an inch below normal rainfall. One final note: Jackson received only 4 days where the high temperature reached or exceeded 90 degrees. Lexington had twice that (9), Louisville had 11 days, and Paducah received 18 days in the 90s...well above normal. Temperatures for the period averaged 75 degrees across the state which was 2 degrees warmer than normal and 12 degrees warmer than the previous period. High temperatures averaged from 87 in the West to 85 in the East. Departure from normal high temperatures ranged from 1 degrees warmer than normal in the West to 2 degrees warmer than normal in the East. Low temperatures averaged from 67 degrees in the West to 63 degrees in the East. Departure from normal low temperature ranged from 3 degrees warmer than normal in the West to 4 degrees warmer than normal in the East. The extreme high temperature for the period was 101 degrees at CAPE GIRARDEAU ASOS and the extreme low was 44 degrees at PAINTSVILLE 4W. Precipitation (liq. equ.) for the period totaled 3.34 inches statewide which was 1.06 inches below normal and 76% of normal. Precipitation totals by climate division, West 2.63 inches, Central 2.92 inches, Bluegrass 3.92 inches and East 3.88 inches, which was 1.66, 1.49, 0.5 and 0.61 inches below normal. By station, precipitation totals ranged from a low of 1.03 inches at MARION 4NE to a high of 8.42 inches at LOUISA 1S. * = Based on preliminary data Summarized and averaged data for the period 20160601 to 20160630(Last 30 Days) (Not for Legal purposes. Departure from Norms based on climate divisional Averages) AIR TEMPERATURE PRECIPITATION ExtremeTemp STATION MAX DEV MIN DEV AVR DEV TOTAL DEV %NORM HI LO -------------------------------------------------------------------------------- WEST(CD1) 87 1 67 3 77 2 2.63 -1.66 61 101 49 CENTRAL(CD2) 86 2 65 3 75 2 2.92 -1.49 66 96 48 BLUEGRASS(CD3) 84 1 63 2 74 2 3.92 -0.50 89 94 48 EAST(CD4) 85 2 63 4 74 3 3.88 -0.61 86 94 44 -------------------------------------------------------------------------------- STATE 86 2 64 2 75 2 3.34 -1.06 76 101 44 === Kentucky Climate Summary For the Period May 2016 Below Normal Temperatures and Above Normal Precipitation: * After an exceptionally wet end to April, the active pattern remained in place for much of May, which is typically the wettest month of the year for Kentucky. The entirety of the state averaged over 5 inches of rainfall with the most falling across Eastern Kentucky (over 6.5 inches on average). The most active period occurred between the 10th and the 12th as the Bluegrass State became situated within a very moist and unstable air mass. Strong to severe storms were seen each day with excessive lightning, heavy rain, large hail, and damaging winds as the main hazards. According to the National Weather Service in Louisville, Washington County saw 2 inch diameter hail. Several tornadoes even touched down in Western and Central Kentucky on that Tuesday. The strongest was seen in Mayfield, where a EF3 tornado touched down with estimated peak winds of 140 mph (EF3 tornado). In response to the abundant rainfall throughout the month, only 1% of the state is now seeing Abnormally Dry Conditions according to the latest update to the US Drought Monitor. The excessive rainfall did lead to slowed planting progress and delayed cutting of hay and alfalfa. Quality of hay was reported to the Kentucky Crop Progress and Condition report as diminishing due to over maturity. It was not really until the last week of May that producers got a descent window to cut. By mid-May, standing water was being seen in many fields. Looking at temperatures, by the middle of May, there is typically a small probability that Kentucky sees another frost or freeze. As shown in the frost/freeze occurrence table, most of Kentucky is approaching the 10% threshold, meaning there is only a 10% chance that the threshold temperature will occur after the respective date. Behind northwest flow, most of the state exceeded that 10% threshold this year, with temperatures dropping into the middle 30s to low 40s by the morning of the 15th. This is roughly 15 to 20 degrees below normal for mid-May. Even cooler temperatures were seen the following morning across Eastern Kentucky and the Northern Bluegrass as lows dropped to freezing in some spots. This led to a third straight week of near to below normal temperatures. The last week of the month brought a drastic change to this pattern as it started to feel more like summer. Through the last week, temperatures were in the 80s about each day, along with an increase in humidity as Gulf moisture filtered into the area. The 27th was one of the hottest days of May as most of the state got into the mid to upper 80s. Temperatures for the period averaged 64 degrees across the state which was 1 degree cooler than normal. High temperatures averaged from 74 in the West to 73 in the East. Departure from normal high temperatures ranged from 4 degrees cooler than normal in the West to 4 degrees cooler than normal in the East. Low temperatures averaged from 55 degrees in the West to 53 degrees in the East. Departure from normal low temperature ranged from near normal in the West to 3 degrees warmer than normal in the East. The extreme high temperature for the period was 90 at PADUCAH ASOS and the extreme low was 32 at OWENTON 5E. Precipitation (liq. equ.) for the period totaled 6.03 inches statewide which was 1.11 inches above normal and 122% of normal. Precipitation totals by climate division, West 5.90 inches, Central 6.40 inches, Bluegrass 5.24 inches and East 6.56 inches, which was 0.84, 1.26, 0.57 and 1.74 inches above normal. By station, precipitation totals ranged from a low of 3.35 inches at ALEXANDRIA 5NW to a high of 13.37 inches at BOWLING GREEN 4E. * = Based on preliminary data Summarized and averaged data for the period 20160501 to 20160531(Last 31 Days) (Not for Legal purposes. Departure from Norms based on climate divisional Averages) AIR TEMPERATURE PRECIPITATION ExtremeTemp STATION MAX DEV MIN DEV AVR DEV TOTAL DEV %NORM HI LO -------------------------------------------------------------------------------- WEST(CD1) 74 -4 55 0 65 -2 5.90 0.84 117 90 34 CENTRAL(CD2) 73 -4 54 0 64 -1 6.40 1.26 125 89 35 BLUEGRASS(CD3) 72 -3 53 1 62 -2 5.24 0.57 112 87 32 EAST(CD4) 73 -4 53 3 63 0 6.56 1.74 136 89 32 -------------------------------------------------------------------------------- STATE 73 -4 54 1 64 -1 6.03 1.11 122 90 32 === Kentucky Climate Summary For the Period April 2016 Above Normal Temperatures and Below Normal Precipitation: * April was the first time month since January that Kentucky had seen below normal precipitation. The month kicked off with a couple rounds of widespread showers and storms as low pressure worked through the area. Conditions then really turned dry heading into the following few weeks. By the April 26th release of the US Drought Monitor, around 55% of the state was showing signs of abnormally dry conditions, mainly in East-Central and Southeastern Kentucky, where precipitation had been lacking for the past 30 to 60 days. Moderate drought even developed across portions of Pike, Floyd, and Martin Counties. While it was dry, excellent progress was made in planting corn. The Kentucky Crop Progress and Condition Report showed 50% of corn in the ground by the 24th, well ahead of the 5 year average of 28%. It really wasn't until the last week of April that the entire state got in on some rainfall. Exceptionally wet conditions soaked the Commonwealth with the state averaging over 2.5 inches. Looking at Eastern Kentucky, this was the first week the area had seen above normal rainfall, after going nine straight week of drier than normal conditions. Overall, the last week really caught up the state on rainfall deficits, ending April with a state average rainfall total around a half inch below normal. Looking at temperatures, the above normal trend continued. The Bluegrass State has now went three straight months of seeing above normal temperatures. Dating back the past year, with the exception of January 2016 and August 2015, every month has seen above normal temperatures. While temperatures were warmer than normal for the month, April did not start out that way. Over the first half of April, numerous Freeze Warnings were issued by the National Weather Service as temperatures plummeted into the 20s at times. Temperatures for the period averaged 58 degrees across the state which was 2 degrees warmer than normal. High temperatures averaged from 70 in the West to 70 in the East. Departure from normal high temperatures ranged from near normal in the West to 1 degree warmer than normal in the East. Low temperatures averaged from 48 degrees in the West to 46 degrees in the East. Departure from normal low temperature ranged from 2 degrees warmer than normal in the West to 5 degrees warmer than normal in the East. The extreme high temperature for the period was 88 at KOOMER RIDGE and the extreme low was 22 at PAINTSVILLE 4W. Precipitation (liq. equ.) for the period totaled 3.57 inches statewide which was 0.78 inches below normal and 82% of normal. Precipitation totals by climate division, West 4.10 inches, Central 3.05 inches, Bluegrass 3.94 inches and East 3.19 inches, which was 0.84, 1.39, 0.03 and 0.87 inches below normal. By station, precipitation totals ranged from a low of 1.26 inches at MAYFIELD 6SW to a high of 6.39 inches at MURRAY 1W. * = Based on preliminary data Summarized and averaged data for the period 20160401 to 20160430(Last 30 Days) (Not for Legal purposes. Departure from Norms based on climate divisional Averages) AIR TEMPERATURE PRECIPITATION ExtremeTemp STATION MAX DEV MIN DEV AVR DEV TOTAL DEV %NORM HI LO -------------------------------------------------------------------------------- WEST(CD1) 70 0 48 2 59 1 4.10 -0.84 83 86 27 CENTRAL(CD2) 70 2 47 3 58 2 3.05 -1.39 69 87 27 BLUEGRASS(CD3) 67 1 45 2 56 1 3.94 -0.03 99 85 24 EAST(CD4) 70 1 46 5 58 3 3.19 -0.87 79 88 22 -------------------------------------------------------------------------------- STATE 69 1 46 2 58 2 3.57 -0.78 82 88 22 === Kentucky Climate Summary For the Period March 2016 Above Normal Temperatures and Below Normal Precipitation: * Preliminary data at the Ag Weather Center shows that March was the second straight month that the Bluegrass State saw above normal temperatures. In fact, after initially seeing fairly cool temperatures over the first week of March, the following 3 weeks all saw above normal temperatures in place. The warmth was most significant over the 2nd week of the month, between the 7th and 13th. The average state temperature of 61 degrees was 16 degrees above normal for this time of year. Over this period, a low pressure system sat over Northern Mexico and Texas, setting up a southerly flow pattern into the Ohio Valley. High temperatures over much of the week stayed in the 60s and 70s. The warmest temperatures were actually seen on the 15th with highs in the upper 70s to middle 80s for most of the state. The warm March set the stage for an earlier start to the 2016 growing season. By the last couple weeks, strawberries and several fruit trees were becoming susceptible to temperatures at or slightly below freezing, prompting the need for some freeze warnings and frost advisories. Looking at precipitation, totals varied across the state with around 5 inches on average across Western Kentucky to just under 2 inches across Eastern Kentucky. In addition to the extremely warm temperatures seen over the second week of the month, rainfall was abundant across the western half of the state. Western Kentucky averaged nearly 3.5 inches as a plume of moisture set up over the area. After this event, conditions became fairly dry over the latter half of the month with 2 straight weeks of below normal precipitation. In comparison to last year, snowfall was relatively light. The only significant event came on March 3rd as portions of Eastern Kentucky saw moderate to heavy snow from time to time. Some locations in the area of Morgan, Elliot, and Rowan counties reported in upwards of 6+ inches. Temperatures for the period averaged 53 degrees across the state which was 6 degrees warmer than normal. High temperatures averaged from 63 in the West to 64 in the East. Departure from normal high temperatures ranged from 3 degrees warmer than normal in the West to 5 degrees warmer than normal in the East. Low temperatures averaged from 44 degrees in the West to 42 degrees in the East. Departure from normal low temperature ranged from 7 degrees warmer than normal in the West to 9 degrees warmer than normal in the East. The extreme high temperature for the period Precipitation (liq. equ.) for the period totaled 4.32 inches statewide which was 0.13 inches below normal and 97% of normal. Precipitation totals by climate division, West 6.84 inches, Central 4.30 inches, Bluegrass 3.89 inches and East 2.24 inches, which was 2.09, -0.39, -0.13 and -2.11 inches respectively from normal. By station, precipitation totals ranged from a low of 1.40 inches at BOONEVILLE 2S to a high of 11.64 inches at MURRAY 1W. * = Based on preliminary data Summarized and averaged data for the period 20160301 to 20160331(Last 31 Days) (Not for Legal purposes. Departure from Norms based on climate divisional Averages) AIR TEMPERATURE PRECIPITATION ExtremeTemp STATION MAX DEV MIN DEV AVR DEV TOTAL DEV %NORM HI LO -------------------------------------------------------------------------------- WEST(CD1) 63 3 44 7 53 4 6.84 2.09 144 87 23 CENTRAL(CD2) 63 5 44 8 53 6 4.30 -0.39 92 85 23 BLUEGRASS(CD3) 61 5 42 8 52 7 3.89 -0.13 97 79 24 EAST(CD4) 64 5 42 9 53 7 2.24 -2.11 51 83 22 -------------------------------------------------------------------------------- STATE 63 5 43 8 53 6 4.32 -0.13 97 87 22 === Kentucky Climate Summary For the Period February 2016 Above Normal Temperatures and Precipitation: * For the month of February, the Commonwealth saw near normal temperatures and above normal rainfall. The state saw an average of 4.86 inches for February, which was over an inch above normal. The month started out very active as a strong storm system pushed through the Lower Ohio Valley. Several lines of showers and storms led to some minor and short-lived flooding. Ahead of this system, temperatures soared into the upper 60s to low 70s in early February. Normal highs for this time of the year are only in the low to mid 40s. The 2nd week of the month brought a return to dry and much cooler temperatures. The state saw another significant winter storm on the 14th with totals ranging from 2 to 6+ inches across the area, with highest accumulations across the southern half of Kentucky. Activity then increased over the latter half of February with multiple rounds of widespread activity. Temperatures were up and down, but once again, the Bluegrass State saw temperatures rise into the 60s and 70s multiple times. This warm trend held true for much of this past winter. The last day of February signals the end of meteorological winter and based on preliminary data, the state was on average, 4 degrees above normal for the season. This would make the 2015-16 winter one of the warmest on record for the state of Kentucky. Temperatures for the period averaged 40 degrees across the state which was 2 degrees warmer than normal. High temperatures averaged from 49 in the West to 47 in the East. Departure from normal high temperatures ranged from 1 degree cooler than normal in the West to 2 degrees cooler than normal in the East. Low temperatures averaged from 32 degrees in the West to 32 degrees in the East. Departure from normal low temperature ranged from 3 degrees warmer than normal in the West to 6 degrees warmer than normal in the East. The extreme high temperature for the period was 76 at LOUISVILLE APT and the extreme low was 2 at PIKEVILLE 13S. Precipitation (liq. equ.) for the period totaled 4.93 inches statewide which was 1.12 inches above normal and 130% of normal. Precipitation totals by climate division, West 4.05 inches, Central 5.24 inches, Bluegrass 4.81 inches and East 5.62 inches, which was -0.18, 1.12, 1.52 and 2.04 inches respectively from normal. By station, precipitation totals ranged from a low of 2.11 inches at POPLAR BLUFF ASOS to a high of 9.16 inches at OWINGSVILLE 4S. * = Based on preliminary data Summarized and averaged data for the period 20160201 to 20160229(Last 29 Days) (Not for Legal purposes. Departure from Norms based on climate divisional Averages) AIR TEMPERATURE PRECIPITATION ExtremeTemp STATION MAX DEV MIN DEV AVR DEV TOTAL DEV %NORM HI LO -------------------------------------------------------------------------------- WEST(CD1) 49 -1 32 3 41 2 4.05 -0.18 96 76 10 CENTRAL(CD2) 48 0 32 4 40 2 5.24 1.12 127 76 13 BLUEGRASS(CD3) 46 0 30 4 38 2 4.81 1.52 146 73 7 EAST(CD4) 47 -2 32 6 39 2 5.62 2.04 157 75 2 -------------------------------------------------------------------------------- STATE 48 -0 32 5 40 2 4.93 1.12 130 76 2 === Kentucky Climate Summary For the Period January 2016 Near Normal Temperatures and Much Below Normal Precipitation: * After a very wet December, the first month of 2016 went in the opposite direction. Over the course of January, preliminary data at the Ag Weather Center shows that Kentucky averaged just over two inches of liquid precipitation. This was over 1.5 inches below normal. While there may have been little in the way of liquid precipitation, January brought the Commonwealth a first glimpse of winter. The state saw multiple snowfall events with the most significant coming over the period of the 21st through the 23rd as a major winter storm worked across the region. Over the course of the event, the entire state was under a Winter Storm Warning. Initially, some ice accumulations were seen in Southern Kentucky, near the Tennessee border. Saying that, eventually all precipitation transitioned to snow, leading to some exceptional snowfall totals. The most significant activity was seen across South-Central and Eastern Kentucky with a widespread swath of 12 to 18+ inches. Following this system, the coldest temperatures of the winter season filtered into the area. A combination of the snowpack and winds slackening led to temperatures in the single digits for lows that weekend. The lowest temperature was seen in Richmond with a reading of -9 degrees. This pushed the livestock cold stress index well into the Emergency Category. This event was just one of multiple cold air outbreaks over the course of the month. Saying that, Kentucky did have a fair share of warmer air filtering into the area, making it feel more like spring at times. One of those periods came over the last couple days of January. Temperatures peaked in the 60s for most of the state each day. Some locations even reached into the 70s. Normal high temperatures for this time of the year are only in the low to mid 40s. Temperatures for the period averaged 33 degrees across the state which was near normal. High temperatures averaged from 43 in the West to 42 in the East. Departure from normal high temperatures ranged from near normal in the West to 2 degrees cooler than normal in the East. Low temperatures averaged from 26 degrees in the West to 24 degrees in the East. Departure from normal low temperature ranged from 1 degree warmer than normal in the West to 1 degree warmer than normal in the East. The extreme high temperature for the period was 73 at RUSSELLVILLE 2W and the extreme low was -9 at RICHMOND 8E. Precipitation (liq. equ.) for the period totaled 2.02 inches statewide which was 1.71 inches below normal and 54% of normal. Precipitation totals by climate division, West 2.29 inches, Central 2.31 inches, Bluegrass 1.38 inches and East 2.09 inches, which was 1.64, 1.68, 1.84 and 1.7 inches below normal. By station, precipitation totals ranged from a low of 0.88 inches at LOUISA 1S to a high of 10.12 inches at EVANSVILLE ASOS. * = Based on preliminary data Summarized and averaged data for the period 20160101 to 20160131(Last 31 Days) (Not for Legal purposes. Departure from Norms based on climate divisional Averages) AIR TEMPERATURE PRECIPITATION ExtremeTemp STATION MAX DEV MIN DEV AVR DEV TOTAL DEV %NORM HI LO -------------------------------------------------------------------------------- WEST(CD1) 43 0 26 1 34 0 2.29 -1.64 58 73 2 CENTRAL(CD2) 42 0 25 0 34 1 2.31 -1.68 58 72 -1 BLUEGRASS(CD3) 40 -1 24 1 32 0 1.38 -1.84 43 69 -9 EAST(CD4) 42 -2 24 1 33 0 2.09 -1.70 55 70 -8 -------------------------------------------------------------------------------- STATE 42 -0 25 1 33 0 2.02 -1.71 54 73 -9#corn uses about 1 inch of water every 3 days right now, probably more with this heat @UKAGweather @UNL_CropWatch pic.twitter.com/g76pgbovQU
— Chad Lee (@KentuckyCrops) July 21, 2016