KENTUCKY MONTHLY AND ANNUAL CLIMATE SUMMARY FOR -- 2015
By: Tom Priddy and Matt Dixon -- UK Agricultural Weather Center
* Based on Preliminary Data. Weekly graphs available within the UKAWC Kentucky
Weather Information Web site. Sources: UKAWC, NCDC and Midwest Regional Climate
Center
===
Kentucky Climate Summary
For the Period December 2015
Record Breaking Temperatures and Much Above Normal Precipitation:
2015 came to an end with an exceptionally warm and wet month of December. In fact,
it was the warmest December on record for the Bluegrass State with data going
back to 1895. The average state temperature for the month came in at 48.6 degrees,
which is 12 degrees above normal. This ended up being the fourth straight
month that the Bluegrass State has seen above normal temperatures. Records fell on
numerous occasions throughout the month as temperatures rose into the 70s at times,
which was around 25 to 30 degrees above normal. In fact, the official start of winter
on the 21st was followed by one of the warmest days of the month on the 23rd. High
temperatures jumped into the mid 60s to around 70. According to the National Weather
Service in Louisville, this past month would be the warmest December on record for
Bowling Green and Frankfort, along with being the 2nd warmest for Louisville and
Lexington.
In addition to the warmth was excessive rainfall. The Bluegrass State averaged over 6
inches for December, making it one of the wettest on record. This past month places
11th on the wettest December's on record. Looking back, this was Kentucky’s third
straight month of above normal precipitation. Most of the rain fell over the latter
half of the month, leading to some flooding across the area. Between the 21st and
27th, the state averaged over 3.5 inches behind multiple frontal boundaries and
disturbances pushing through the state.
Temperatures for the period averaged 49 degrees across the state which was 11 degrees
warmer than normal. Temperatures averaged from 48 in the West to 49 in the East.
Departure from normal temperatures ranged from 11 degrees warmer than normal in the
West to 12 degrees warmer than normal in the East. The extreme high temperature for
the period was 78 at PAINTSVILLE 4W and the extreme low was 18 at BARBOURVILLE 3E.
Precipitation (liq. equ.) for the period totaled 6.74 inches statewide which was 2.46
inches above normal and 157% of normal. Precipitation totals by climate division,
West 7.19 inches, Central 7.68 inches, Bluegrass 6.93 inches and East 5.60 inches,
which was 2.62, 2.85, 2.95 and 1.73 inches respectively from normal. By station,
precipitation totals ranged from a low of 1.11 inches at BRANDENBURG 4SW to a high of
9.39 inches at BENTON 4N.
* = Based on preliminary data
===
Kentucky Climate Summary
For the Period November 2015
Above Normal Temperatures and Precipitation: *
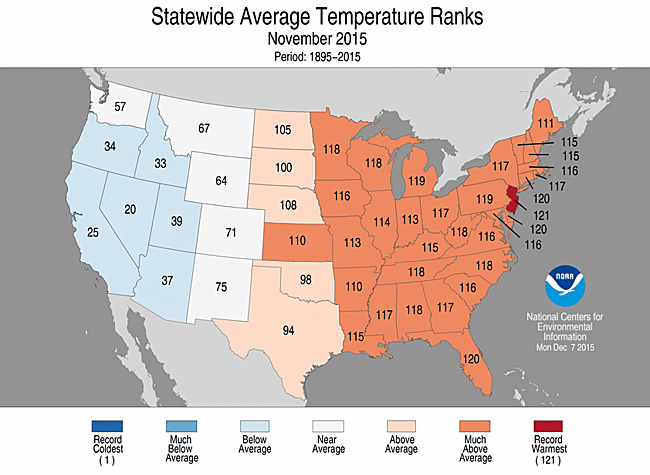
The warm temperatures were the story of November 2015. On average, the state was 4
degrees above normal for the month, which resulted in a 3rd straight month of above
normal temperatures. This placed as the 7th warmest November on record for the
Bluegrass State with records going back to 1895. As seen in the map below, it can be
seen that the same warm trend held true for much of the eastern half of the United
States. Cold air outbreaks were nearly nonexistent with the coldest temperatures
coming on the 23rd with much of the state waking up to readings in the upper teens to
low 20s. Depending on location, the warm weather was accompanied by either above or
below normal rainfall. Monthly totals averaged over 6 inches across Western Kentucky,
before diminishing to a little over 2.5 inches across Eastern Kentucky.
Temperatures for the period averaged 52 degrees across the state which was 4 degrees
warmer than normal. High temperatures averaged from 62 in the West to 62 in the
East. Departure from normal high temperatures ranged from 3 degrees warmer than
normal in the West to 3 degrees warmer than normal in the East. Low temperatures
averaged from 44 degrees in the West to 43 degrees in the East. Departure from
normal low temperature ranged from 6 degrees warmer than normal in the West to 9
degrees warmer than normal in the East. The extreme high temperature for the period
was 82 at PEABODY and the extreme low was 15 at BOONEVILLE 2S.
Precipitation (liq. equ.) for the period totaled 4.31 inches statewide which was 0.4
inches above normal and 110% of normal. Precipitation totals by climate division,
West 6.72 inches, Central 4.80 inches, Bluegrass 3.13 inches and East 2.58 inches,
which was 2.20, 0.69, -0.28 and -1.00 inches respectively from normal. By station,
precipitation totals ranged from a low of 1.28 inches at LOUISA 1S to a high of 10.83
inches at POPLAR BLUFF ASOS.
* = Based on preliminary data
Summarized and averaged data for the period 20151101 to 20151130(Last 30 Days)
(Not for Legal purposes. Departure from Norms based on climate divisional Averages)
AIR TEMPERATURE PRECIPITATION ExtremeTemp
STATION MAX DEV MIN DEV AVR DEV TOTAL DEV %NORM HI LO
--------------------------------------------------------------------------------
WEST(CD1) 62 3 44 6 53 4 6.72 2.20 149 80 17
CENTRAL(CD2) 62 4 44 7 53 5 4.80 0.69 117 80 18
BLUEGRASS(CD3) 60 3 42 5 50 3 3.13 -0.28 92 78 17
EAST(CD4) 62 3 43 9 52 5 2.58 -1.00 72 82 15
--------------------------------------------------------------------------------
STATE 62 4 43 6 52 4 4.31 0.40 110 82 15
===
Kentucky Climate Summary
For the Period October 2015
Above Normal Temperatures and Rainfall: *
October is typically one of the driest months of the year for the Bluegrass State.
Most of October 2015 followed that trend with three straight weeks of below normal
rainfall to begin the month. The dry conditions were most noticeable in Western
Kentucky where the US Drought Monitor had much of the area under a 'Moderate
Drought' or 'Abnormally Dry Conditions'. Rain was needed and the skies
opened over the last week of October, leading to much above normal rainfall for the
Commonwealth. Other than Eastern Kentucky, the majority of the state averaged over
two inches for the week behind multiple rounds of widespread showers ahead of a low
pressure system to the south. After three straight weeks of below normal rainfall,
the last week of October actually pushed the state about a half inch above normal for
the month.
Behind a couple cold fronts, areas of frost developed on the nights of the 16th and
17th, bringing an end to the growing season. The night of the 17th was the coldest
as much of the state dropped below freezing. Many rural locations dipped into the
mid to upper 20s. This would be about 15 to 20 degrees below normal for that point in
the year. Looking below at the average dates of a first freeze across the state,
middle to late October is common.
Temperatures for the period averaged 59 degrees across the state which was 1 degree
warmer than normal. High temperatures averaged from 71 in the West to 68 in the East.
Departure from normal high temperatures ranged from 1 degree cooler than normal in
the West to 2 degrees cooler than normal in the East. Low temperatures averaged from
49 degrees in the West to 48 degrees in the East. Departure from normal low
temperature ranged from 2 degrees warmer than normal in the West to 5 degrees warmer
than normal in the East. The extreme high temperature for the period was 87 at
BURLINGTON 4S and the extreme low was 24 at CYNTHIANA 8N.
Precipitation (liq. equ.) for the period totaled 3.44 inches statewide which was 0.14
inches above normal and 104% of normal. Precipitation totals by climate division,
West 3.56 inches, Central 4.18 inches, Bluegrass 3.57 inches and East 2.43 inches,
which was 0.05, 0.78, 0.48 and -0.78 inches respectively from normal. By station,
precipitation totals ranged from a low of 0.77 inches at KOOMER RIDGE to a high of
6.07 inches at BRANDENBURG 4SW.
* = Based on preliminary data
Summarized and averaged data for the period 20151001 to 20151031(Last 31 Days) (Not
for Legal purposes. Departure from Norms based on climate divisional Averages)
AIR TEMPERATURE PRECIPITATION ExtremeTemp
STATION MAX DEV MIN DEV AVR DEV TOTAL DEV %NORM HI LO
--------------------------------------------------------------------------------
WEST(CD1) 71 -1 49 2 60 1 3.56 0.05 101 86 26
CENTRAL(CD2) 69 -1 49 3 59 1 4.18 0.78 123 86 25
BLUEGRASS(CD3) 67 -2 48 2 58 1 3.57 0.48 116 87 24
EAST(CD4) 68 -2 48 5 58 1 2.43 -0.78 76 84 26
--------------------------------------------------------------------------------
STATE 69 -1 48 2 59 1 3.44 0.14 104 87 24
===
Kentucky Climate Summary
For the Period September 2015
Above Normal Temperatures and Below Normal Rainfall:
Precipitation has followed an up and down trend throughout the year. There have been
multiple periods where drought entered into the picture, but at the same time, were
followed by extreme precipitation events. September kept that trend in place.
The opening week of the month brought extremely warm temperatures and dry conditions.
Labor Day weekend saw temperatures in the low to mid 90s across much of the state.
The state averaged less than a tenth of an inch over the same span and after going
through an exceptionally wet summer, abnormally dry conditions were once again
showing up across the state. In the article found here, the USDA Crop Progress and Condition
Report points to some of the agricultural impacts seen across the state.
Cooler temperatures invaded the area behind a cold front on the 9th, along with
scattered to numerous showers and storms, but activity was not widespread across the
entire area. After another couple dry weeks to end the month, the US Drought Monitor
reintroduced 'Moderate Drought' to South-Central Kentucky and up into the
Southern Bluegrass, along with a slight portion of Southeastern Kentucky. Over half
remained abnormally dry. Heading into the closing days of September, the state had
seen much below normal rainfall three of the past four weeks. While the state did
need some rainfall, the dry pattern setup a lengthy period of excellent harvesting
conditions.
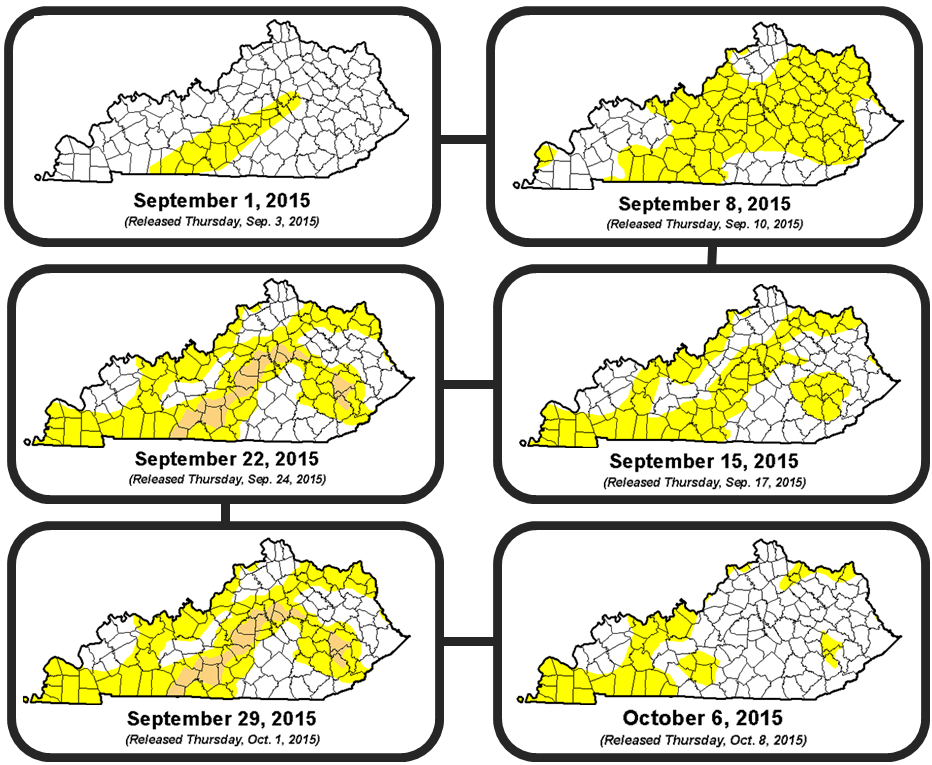
With that said, the skies opened at the end of the month, leading to an abundant
amount of rainfall as several disturbances rotated around an upper level low to the
south. The first update to the US Drought Monitor in October removed any mention of
'Moderate Drought', while also diminishing the coverage of area seeing
'Abnormally Dry Conditions'. Below is a timeline, showing how drought
conditions changed throughout the month of September across the state of Kentucky.
All maps are taken from each update of the US Drought
Monitor. Anything shaded in yellow signifies 'Abnormally Dry
Conditions', while light brown stands for 'Moderate Drought'.
Temperatures for the period averaged 71 degrees across the state which was 2 degrees
warmer than normal and 2 degrees cooler than the previous period. High temperatures
averaged from 83 in the West to 80 in the East. Departure from normal high
temperatures ranged from 1 degree warmer than normal in the West to near
normal in the East. Low temperatures averaged from 60 degrees in the West to 60
degrees in the East. Departure from normal low temperature ranged from 1 degree
warmer than normal in the West to 4 degrees warmer than normal in the East. The
extreme high temperature for the period was 97 degrees at BOWLING GREEN APT and the
extreme low was 34 degrees at WILLIAMSBURG AWOS.
Precipitation (liq. equ.) for the period totaled 2.64 inches statewide which was 0.88
inches below normal and 75% of normal. Precipitation totals by climate division, West
1.62 inches, Central 3.02 inches, Bluegrass 2.99 inches and East 2.93 inches, which
was 1.87, 0.85, 0.23 and 0.55 inches below normal. By station, precipitation totals
ranged from a low of 0.49 inches at OWENSBORO AWSS to a high of 7.11 inches at
STANFORD 4NE.
Summarized and averaged data for the period 20150901 to 20150930(Last 30 Days)
(Not for Legal purposes. Departure from Norms based on climate divisional Averages)
AIR TEMPERATURE PRECIPITATION ExtremeTemp
STATION MAX DEV MIN DEV AVR DEV TOTAL DEV %NORM HI LO
--------------------------------------------------------------------------------
WEST(CD1) 83 1 60 1 72 1 1.62 -1.87 46 96 41
CENTRAL(CD2) 82 1 59 1 71 2 3.02 -0.85 78 97 42
BLUEGRASS(CD3) 81 1 59 2 70 2 2.99 -0.23 93 95 41
EAST(CD4) 80 0 60 4 70 2 2.93 -0.55 84 94 34
--------------------------------------------------------------------------------
STATE 82 1 60 2 71 2 2.64 -0.88 75 97 34
===
Kentucky Climate Summary
For the Period: August 2015
Below Normal Temperatures and Rainfall: *
Temperatures for the period averaged 73 degrees across the state which was 2 degrees
cooler than normal. High temperatures averaged from 84 in the West to 82 in the
East. Departure from normal high temperatures ranged from 4 degrees cooler than
normal in the West to 4 degrees cooler than normal in the East. Low temperatures
averaged from 64 degrees in the West to 63 degrees in the East. Departure from
normal low temperature ranged from 2 degrees cooler than normal in the West to 1
degree warmer than normal in the East. The extreme high temperature for the period
was 96 at BOWLING GREEN 4E and the extreme low was 48 at BRANDENBURG 4SW.
Precipitation (liq. equ.) for the period totaled 2.75 inches statewide which was 1.04
inches below normal and 73% of normal. Precipitation totals by climate division, West
3.01 inches, Central 2.28 inches, Bluegrass 2.65 inches and East 3.07 inches, which
was 0.51, 1.49, 1.12 and 1.03 inches below normal. By station, precipitation totals
ranged from a low of 0.06 inches at PEABODY to a high of 6.30 inches at CADIZ 4SW.
* = Based on preliminary data
Summarized and averaged data for the period 20150801 to 20150831(Last 31 Days)
(Not for Legal purposes. Departure from Norms based on climate divisional Averages)
AIR TEMPERATURE PRECIPITATION ExtremeTemp
STATION MAX DEV MIN DEV AVR DEV TOTAL DEV %NORM HI LO
--------------------------------------------------------------------------------
WEST(CD1) 84 -4 64 -2 74 -3 3.01 -0.51 86 95 48
CENTRAL(CD2) 83 -4 63 -2 73 -3 2.28 -1.49 60 96 48
BLUEGRASS(CD3) 82 -3 62 -2 72 -3 2.65 -1.12 70 90 49
EAST(CD4) 82 -4 63 1 73 -1 3.07 -1.03 75 93 49
--------------------------------------------------------------------------------
STATE 83 -4 63 -1 73 -2 2.75 -1.04 73 96 48
===
Kentucky Climate Summary
For the Period: July 2015
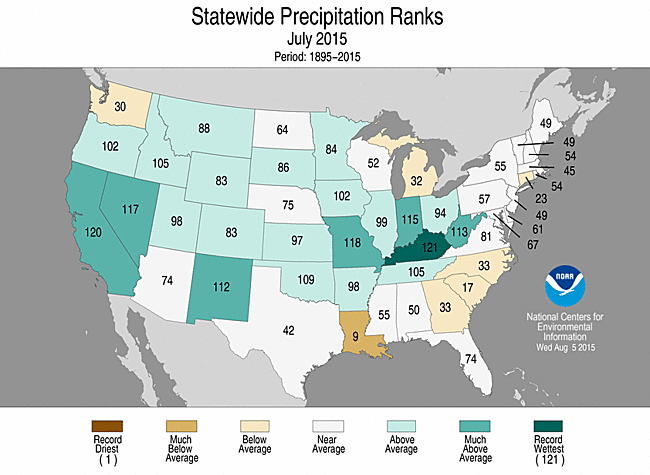
Near Normal Temperatures and Record Breaking Rainfall: *
"When is it going to stop raining?" – One of the most common questions asked to the Weather Center over the first half of July, but for
good reason. This was the WETTEST July on record for the Bluegrass State with data going back into the late 1800's. How wet was it?
Officially, the state averaged 8.99 inches, which is over four and a half inches above normal. This beat out the previous record of
8.25 inches, set all the way back in 1910. Looking back at 1910, Professor H.C. Frankenfield offered an interesting insight on impacts
of the excessive rainfall in Kentucky. He stated in his 'Rivers and Floods' update that a tremendous amount of damage was seen due to
torrential rainfall and associated tributary overflow. He related the damage to tobacco and property loss, at the value of two million dollars.
Fast forward to 2015 and flooding was once again an issue. The month started off with the state situated within a northwest flow aloft,
which directed a number of disturbances into the Lower Ohio Valley. Interacting with a frontal boundary at the surface, storms were
fired on a daily basis. A very moist air mass combined with already saturated grounds and led to the threat of flash flooding. During
this first week, the state averaged nearly three inches. According to normals, Kentucky typically only sees 4 to 4.5 inches for the
entire month.
The active pattern didn't end there and remained in place for the first half of the month. A combination of frontal boundaries and
upper level disturbances kept flooding in the picture. The USDA Crop Progress and Condition Report continually described the damage to
crops on a week to week basis with some underwater and destroyed. Multiple rounds of rainfall kept hay from being harvested and resulted
in diminished quality. Other crops were showing signs of stress and led to yellowing fields. Dr. Chad Lee, Extension Professor
and Agronomist at the University of Kentucky, put together an excellent article on yellow soybeans and the need for sun, found here.
Dr. John Strang, UK Extension Horticulturist, also described the difficulty that had came with finding a day to spray in the latest
edition of Kentucky Fruit Facts.
Some of the worst impacts to the excessive rainfall were felt in Eastern Kentucky. The National Weather Service in Jackson put
together a summary of the flash flooding seen across the area on the 13th and 14th. The worst of it was felt in Johnson County, where
radar indicated estimates of around 3 inches per hour.
The Commonwealth didn't get much of a break until the latter half of the month. The state actually saw below normal precipitation for a
couple straight weeks, breaking a five week span of much above normal precipitation. Going back to March, four of the past five months
have now seen above normal precipitation. Between the beginning of January and end of July, the state has averaged 37.04 inches. Since 1895,
this year would place as the 8th wettest for that time span.
Temperatures were actually near normal for the month. Cloud cover and abundant rainfall kept the mercury at bay for much of
the period, but there were multiple times when extreme heat built into the area. The heat index pushed to around 110 on several
occasions in Western Kentucky as temperatures peaked in the mid 90s and combined with muggy conditions. The National Weather
Service in Paducah put together the image below showing the highest heat index values on the 29th. This pushed the livestock heat
stress index into the emergency category.
* = Based on preliminary data
Summarized and averaged data for the period 20150701 to 20150731(Last 31 Days)
(Not for Legal purposes. Departure from Norms based on climate divisional Averages)
AIR TEMPERATURE PRECIPITATION ExtremeTemp
STATION MAX DEV MIN DEV AVR DEV TOTAL DEV %NORM HI LO
--------------------------------------------------------------------------------
WEST(CD1) 87 -2 71 4 79 1 7.71 3.47 182 97 60
CENTRAL(CD2) 86 -2 69 3 78 1 6.90 2.52 158 95 58
BLUEGRASS(CD3) 84 -2 67 2 75 -1 8.70 4.44 204 94 57
EAST(CD4) 84 -3 67 4 76 1 7.76 3.26 172 94 57
--------------------------------------------------------------------------------
STATE 85 -2 68 3 77 0 7.77 3.42 179 97 57
===
Kentucky Climate Summary
For the Period: June 2015
Above Normal Temperatures and Below Normal Precipitation: *
June 1st signaled the first day of summer and right on cue, heat and humidity was on
the return. Throughout the month, the Bluegrass State saw numerous times when
temperatures rose past the 90 degree threshold. The most significant period came the
second week of the month when an upper level ridge bumped highs into the mid 80s to
low 90s on a consistent basis. Dewpoints in the upper 60s to low 70s made for a very
humid air mass, pushing the livestock heat stress index into the danger category.
The heat was taken a step further over the latter half of the month with numerous
locations rising into the mid 90s. Livestock stress reached the emergency category
over the last week of June as high humidity made it feel more like 100 at times.
After going through an extremely cold winter, the state has now gone three straight
months with above normal temperatures.
Precipitation came in slightly above normal for the month of June, but not before
starting the month with 2 more weeks of below normal rainfall. At that time, the
Commonwealth had seen below normal rainfall for seven of the past eight weeks. In
fact, the US Drought Monitor reintroduced Moderate Drought to portions of
Southeastern Kentucky and the Northern Bluegrass. Concerns subsided over the latter
half of the month as the state was pushed into a very active and wet pattern. A
combination of frontal boundaries, disturbances aloft, and even the remnants of
Tropical Storm Bill left the state with an abundance of rainfall. A moist air mass
allowed for torrential rainfall at times. Through the last two weeks of June, the
state averaged over 3.5 inches.
Temperatures for the period averaged 74 degrees across the state which was 2 degrees
warmer than normal. High temperatures averaged from 85 in the West to 83 in the
East. Departure from normal high temperatures ranged from 1 degree cooler than
normal in the West to near normal in the East. Low temperatures averaged
from 67 degrees in the West to 64 degrees in the East. Departure from normal low
temperature ranged from 4 degrees warmer than normal in the West to 5 degrees warmer
than normal in the East. The extreme high temperature for the period was 96 at
BOWLING GREEN 4E and the extreme low was 50 at GREENVILLE 6N.
Precipitation (liq. equ.) for the period totaled 5.20 inches statewide which was 0.78
inches above normal and 118% of normal. Precipitation totals by climate division,
West 4.32 inches, Central 5.34 inches, Bluegrass 6.15 inches and East 4.98 inches,
which was 0.01, 0.91, 1.72 and 0.48 inches above normal. By station, precipitation
totals ranged from a low of 1.17 inches at HICKMAN 2E to a high of 9.53 inches at
HARRODSBURG 3N.
* = Based on preliminary data
Summarized and averaged data for the period 20150601 to 20150630(Last 30 Days)
(Not for Legal purposes. Departure from Norms based on climate divisional Averages)
AIR TEMPERATURE PRECIPITATION ExtremeTemp
STATION MAX DEV MIN DEV AVR DEV TOTAL DEV %NORM HI LO
--------------------------------------------------------------------------------
WEST(CD1) 85 -1 67 4 76 2 4.32 0.01 100 95 50
CENTRAL(CD2) 84 0 66 4 75 2 5.34 0.91 121 96 50
BLUEGRASS(CD3) 82 -1 64 3 73 1 6.15 1.72 139 94 51
EAST(CD4) 83 0 64 5 74 3 4.98 0.48 111 95 51
--------------------------------------------------------------------------------
STATE 84 0 65 4 74 2 5.20 0.78 118 96 50
===
Kentucky Climate Summary
For the Period: May 2015
Above Normal Temperatures and Below Normal Precipitation: *
After getting drenched in April, May went down the opposite road. The month started
off very dry with little to no rainfall for much of the state as high pressure kept
rainfall at bay. Initially, after being forced out of the field for much of April,
the dry conditions pushed corn planting into full swing. Planting progress quickly
caught up and surpassed the five year average, but after a couple straight weeks of
dry weather, moisture was again a need. Western Kentucky did see abundant rainfall
over the third weekend of the month (average of 1.79 inches), but totals diminished
farther east with Eastern Kentucky only coming in at a little over a half inch for
the three day period. The USDA Crop Progress and Condition Report also stated that
dry pasture conditions led to producers feeding hay to cattle. For the first time
since March 3rd, the May 26th update to the US Drought Monitor reintroduced abnormally
dry conditions to the majority of the eastern half of the state (image below).
Climatologically speaking, May is the wettest month of the year for the Bluegrass
State, but by the end of May, five of the past six weeks had seen below normal
rainfall. For the month, the state only averaged 2.55 inches, well below the norm of
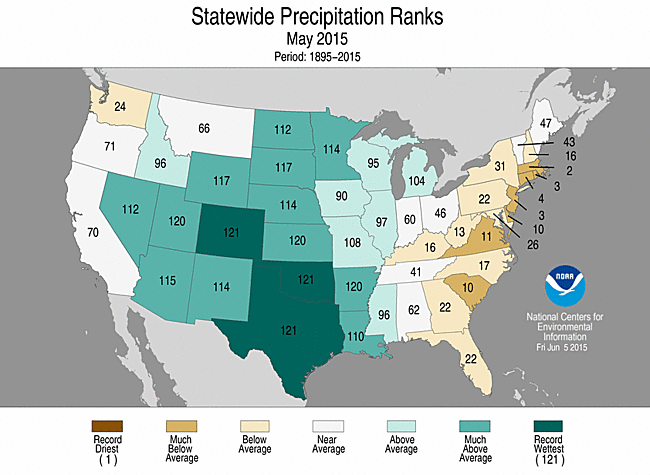
5.29. In fact, it was the 16th driest May on record for the state of Kentucky with
data going back to 1895 (image above). The Bluegrass area and Eastern Kentucky each
averaged less than two inches.
Temperatures-wise, it was a typical spring-like pattern with your usual up and down
temperature swings. The Commonwealth hit the upper 80s to low 90s multiple times
throughout the month, pushing the state to a rather mild May as a whole, nearly three
degrees above normal. Looking the other direction, max temperatures did not get out
of the 50s for many locations on the 21st, before dropping into
the upper 30s that night. These temperatures are more typical of mid-March.
May is typically one of the more active months when it comes to severe weather in
Kentucky, but that was not the case this year. Occurrences were far and few between.
One event occurred on the 11th as a squall line pushed through the region. UK Ag
Weather had the opportunity to accompany the National Weather Service in Louisville
on a storm survey (Scott County). A picture below displays some of the damage, which
was determined to be caused by straight-line winds as a squall line moved through the area.
Temperatures for the period averaged 68 degrees across the state which was 4 degrees
warmer than normal. High temperatures averaged from 78 in the West to 80 in the East.
Departure from normal high temperatures ranged from near normal in the West to 4
degrees warmer than normal in the East. Low temperatures averaged from 58 degrees
in the West to 56 degrees in the East. Departure from normal low temperature ranged
from 3 degrees warmer than normal in the West to 6 degrees warmer than normal in
the East. The extreme high temperature for the period was 90 at BOWLING GREEN APT
and the extreme low was 34 at MONTICELLO AWOS.
Precipitation (liq. equ.) for the period totaled 2.80 inches statewide which was 2.12
inches below normal and 57% of normal. Precipitation totals by climate division, West
4.38 inches, Central 2.92 inches, Bluegrass 1.93 inches and East 1.97 inches, which
was 0.7, 2.22, 2.73 and 2.84 inches below normal. By station, precipitation totals
ranged from a low of 0.86 inches at TRIANGLE MOUNTAIN to a high of 8.28 inches at
POPLAR BLUFF ASOS.
* = Based on preliminary data
Summarized and averaged data for the period 20150501 to 20150531(Last 31 Days)
(Not for Legal purposes. Departure from Norms based on climate divisional Averages)
AIR TEMPERATURE PRECIPITATION ExtremeTemp
STATION MAX DEV MIN DEV AVR DEV TOTAL DEV %NORM HI LO
--------------------------------------------------------------------------------
WEST(CD1) 78 0 58 3 68 2 4.38 -0.70 86 89 35
CENTRAL(CD2) 79 3 57 4 68 3 2.92 -2.22 57 90 35
BLUEGRASS(CD3) 78 3 57 5 68 4 1.93 -2.73 41 89 36
EAST(CD4) 80 4 56 6 68 5 1.97 -2.84 41 90 34
--------------------------------------------------------------------------------
STATE 79 3 57 4 68 4 2.80 -2.12 57 90 34
===
Kentucky Climate Summary
For the Period: April 2015
Above Normal Temperatures and Much Above Normal Precipitation: *
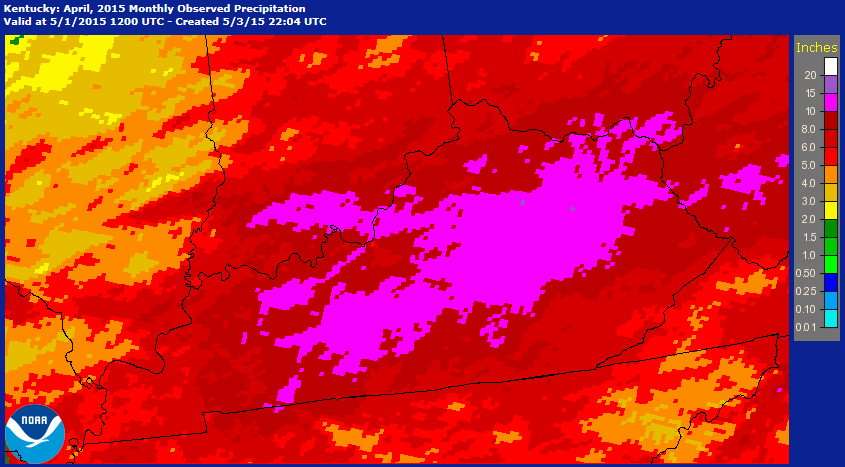
If April showers bring May flowers, then what does April flooding bring? Time will
tell, but this past month will go down as the second wettest April on record with
data going back through 1895 (table below). The Commonwealth saw an average of a
little over 8 inches statewide, but this is still well behind the record-breaking
month of 2011 with more than 12. Putting this into perspective, normal total rainfall
for the month of April is 4.10 inches. Most of the precipitation fell over the first
half of the month. A very active pattern set up over the opening week of April as a
frontal boundary stalled across the area. Portions of the Bluegrass area, especially
along the I-64 corridor, received around 5 to 7+ inches of rain over a two day
period. This led to significant flooding in low lying areas and along creeks/rivers.
The wet pattern continued into the second week of April where rainfall was seen on a
daily basis through the work week. Multiple disturbances passed through the area and
were fueled by a very moist air mass in place. The wet conditions really took a toll
on agriculture, especially when it came to planting corn. As of April 20th, the USDA
Crop Progress and Condition Report stated that Kentucky was 2 to 3 weeks behind
schedule. The last report, issued on May 3rd, stated that only 25% of corn
had been planted in the Bluegrass State, well behind the 5 year average of 52%.
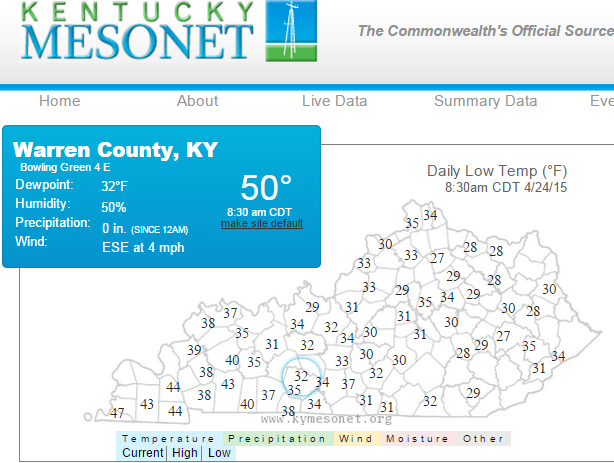
Kentucky finally saw a break from the rainfall over the latter couple weeks of the
month, but not without freezing temperatures and a round of severe weather. High
pressure shifted overhead on the night of the 23rd. Clearing skies and calm winds led
many locations across the eastern half of the state to dip into the upper 20s to low
30s (Image below - Kentucky Mesonet), which was roughly 20 degrees below normal for
late April. Dr. John Strang (UK Extension Horticulturist) stated in the latest
edition of Fruit Facts that some strawberry flowers and new grape growth suffered damage
in the event. Just a few days after, attention swung to severe weather as a warm
front stalled across the state. Storms fired within a warm and unstable air mass,
leading to large hail reports, damaging winds, and a few
tornadoes (EF2 in Edmonson County, EF1 in Adair, and EF0 in Henderson).
Temperatures for the period averaged 58 degrees across the state which was 2 degrees
warmer than normal. High temperatures averaged from 70 in the West to 69 in the
East. Departure from normal high temperatures ranged from 1 degree warmer than
normal in the West to 1 degree warmer than normal in the East. Low temperatures
averaged from 50 degrees in the West to 47 degrees in the East. Departure from
normal low temperature ranged from 4 degrees warmer than normal in the West to 7
degrees warmer than normal in the East. The extreme high temperature for the period
was 87 at BOONEVILLE 2S and the extreme low was 26 at FORT CAMPBELL.
Precipitation (liq. equ.) for the period totaled 8.03 inches statewide which was 3.69
inches above normal and 185% of normal. Precipitation totals by climate division,
West 6.72 inches, Central 8.58 inches, Bluegrass 9.05 inches and East 7.76 inches,
which was 1.8, 4.15, 5.09 and 3.71 inches above normal. By station, precipitation
totals ranged from a low of 4.17 inches at CAPE GIRARDEAU ASOS to a high of 12.51
inches at RICHMOND 8E.
* = Based on preliminary data
Summarized and averaged data for the period 20150401 to 20150430(Last 30 Days)
(Not for Legal purposes. Departure from Norms based on climate divisional Averages)
AIR TEMPERATURE PRECIPITATION ExtremeTemp
STATION MAX DEV MIN DEV AVR DEV TOTAL DEV %NORM HI LO
--------------------------------------------------------------------------------
WEST(CD1) 70 1 50 4 60 2 6.72 1.80 137 85 26
CENTRAL(CD2) 69 1 49 5 59 3 8.58 4.15 194 84 27
BLUEGRASS(CD3) 66 0 46 4 56 2 9.05 5.09 229 83 27
EAST(CD4) 69 1 47 7 58 4 7.76 3.71 192 87 26
--------------------------------------------------------------------------------
STATE 68 0 48 5 58 2 8.03 3.69 185 87 26
===
Kentucky Climate Summary
For the Period: March 2015
Below Normal Temperatures and Above Normal Precipitation: *
March can be seen as a transition month for the Bluegrass State and that statement
more than held true for 2015. March roared in like a lion with a late season, record
breaking winter storm. The event started out on the 3rd with excessive rainfall in
place. In addition to melting snow, flooding was prevalent across the state. The next
day, colder air filtered into the area, transitioning precipitation type to snow.
Moderate to heavy snow led to recording breaking snowfall across much of the state.
The highest accumulations fell on a line that ran through Elizabethtown and Frankfort
where totals ranged from 18 to 24 inches. Lexington saw 17.1 and came out to be the
heaviest two day snowfall total ever recorded. In making matters worse, the state saw
another shot of Arctic air soon after. Much of the Commonwealth once again saw the
mercury plummet well below zero, which was over 30 degrees below normal for that time
of the year. Livestock stress once again moved into the Emergency Category for an
extended period of time. At this point, the state had gone 4 straight weeks of seeing
below normal temperatures.
The second week of the month brought about a turn in the tide and the mercury was on
the rise. Saying that, the wet pattern was extended with two additional rounds of
low pressure passing through the area. Each event saw an average of 1 to 2 inches.
By the end of the first half of March, the state had averaged nearly 6 inches of
precipitation. In doing so, the US Drought Monitor removed any mention of abnormally
dry conditions or drought.
Over the second half, a much needed dry pattern set up across the area and kept the
state out of record territory. Based on preliminary data, the stated averaged just
under 7 inches of precipitation for March. This would place in the top 20 for wettest
March’s on record, but still a long ways from March of 1997, when the state averaged
over 11 inches. The latter two weeks of the month also brought more of a
rollercoaster pattern when looking at temperatures. Some days would see the
thermometer peak in the 70s, while others would see it falling well below seasonable
norms. Behind a cold front, low temperatures plummeted into the teens and 20s over
the final weekend of March.
Temperatures for the period averaged 45 degrees across the state which was 2 degrees
cooler than normal. High temperatures averaged from 55 in the West to 57 in the
East. Departure from normal high temperatures ranged from 4 degrees cooler than
normal in the West to 2 degrees cooler than normal in the East. Low temperatures
averaged from 36 degrees in the West to 36 degrees in the East. Departure from
normal low temperature ranged from 1 degree cooler than normal in the West to 3
degrees warmer than normal in the East. The extreme high temperature for the period
was 79 at GREENVILLE 6N and the extreme low was -15 at BRANDENBURG 4SW.
Precipitation (liq. equ.) for the period totaled 6.87 inches statewide which was 2.56
inches above normal and 160% of normal. Precipitation totals by climate division,
West 7.38 inches, Central 7.13 inches, Bluegrass 7.25 inches and East 5.72 inches,
which was 2.79, 2.6, 3.36 and 1.51 inches above normal. By station, precipitation
totals ranged from a low of 3.96 inches at MIDDLESBORO AWOS to a high of 9.90
inches at PADUCAH ASOS.
* = Based on preliminary data
Summarized and averaged data for the period 20150301 to 20150330(Last 30 Days)
(Not for Legal purposes. Departure from Norms based on climate divisional Averages)
AIR TEMPERATURE PRECIPITATION ExtremeTemp
STATION MAX DEV MIN DEV AVR DEV TOTAL DEV %NORM HI LO
--------------------------------------------------------------------------------
WEST(CD1) 55 -4 36 -1 46 -2 7.38 2.79 161 79 -13
CENTRAL(CD2) 56 -2 36 0 46 -1 7.13 2.60 157 78 -15
BLUEGRASS(CD3) 52 -4 34 0 43 -2 7.25 3.36 186 76 -12
EAST(CD4) 57 -2 36 3 46 0 5.72 1.51 136 79 -13
--------------------------------------------------------------------------------
STATE 55 -3 36 1 44 -2 6.87 2.56 160 79 -15
===
Kentucky Climate Summary
For the Period: February 2015
Much Below Normal Temperatures and Below Normal Precipitation: *
Record breaking cold temperatures overran the Bluegrass State through the month of
February. Multiple Arctic air outbreaks pushed the Commonwealth to a state average
temperature of 27 degrees for the last month of meteorological winter. This was
roughly 10 degrees below normal and based on preliminary data, would be the fourth
coldest February on record with data going back to 1895. The cold started digging
into the area by the month’s midsection and lasted through the remainder, going 3
straight weeks with much below normal temperatures in place. Up until the third week
of the month, dry conditions persisted across the Bluegrass State. Kentucky had seen
seven straight weeks of below normal precipitation. By this time, the US Drought
Monitor had placed over half of the state in Moderate Drought. Then conditions
took a drastic turn.
A major winter storm pushed through the area on the 16th. Significant snowfall was
seen across the entirety of the state with totals of 8 to 12 inches common. This was
followed by an Arctic front the following night that dropped another 1 to 2 inches.
Behind the snow, dangerously cold air built into the Commonwealth. The majority of
the state woke up on the 19th and 20th to record breaking temperatures that were well
below zero. Temperatures by sunrise on the 19th hovered between -5 and -15 for many
locations and only rose into the single digits that day. Some saw wind chills in
excess of -25 below zero. Arctic high pressure then built over the area that night,
setting up extremely cold air over portions of the Bluegrass and Eastern Kentucky.
Temperatures dropped between -10 and -20 for many locations, but some dropped much
further. The coldest reading was with the Kentucky Mesonet station in Richmond, which
dropped to -32 degrees. Putting this into perspective, the state record low
temperature was set back in January of 1994 with a reading of -37 degrees in
Shelbyville. Records were broken in Lexington, Louisville, Bowling Green, and
Frankfort that spanned back over 100 years, into the late 1800s. The cold
temperatures set up extremely dangerous conditions for livestock, placing the index
in the emergency category for an extended period of time.
Another winter storm setup that weekend, but this time around, temperatures were on
the increase, which allowed for a wintry mix across the area. Ice was more common
across the southern half of Kentucky with minor snow accumulations further north.
Some locations saw around a quarter inch of ice accumulation. Over the course of the
event, the Commonwealth saw between 1 to 3 inches of liquid equivalent. In addition
to the melting snowpack, flooding arose, especially in low lying areas. The National
Weather Service in Jackson also reported flooding due to ice jams. While moderate
drought had expanded across the area to start the month, it took a step
back to end February. By February 24th, the US Drought Monitor reported only 5% of
the state in moderate drought.
Temperatures for the period averaged 27 degrees across the state which was 10 degrees
cooler than normal. High temperatures averaged from 37 in the West to 37 in the
East. Departure from normal high temperatures ranged from 12 degrees cooler than
normal in the West to 12 degrees cooler than normal in the East. Low temperatures
averaged from 20 degrees in the West to 18 degrees in the East. Departure from
normal low temperature ranged from 9 degrees cooler than normal in the West to 7
degrees cooler than normal in the East. The extreme high temperature for the period
was 66 at LOUISA 1S and the extreme low was -32 at RICHMOND 8E.
Precipitation (liq. equ.) for the period totaled 3.45 inches statewide which was 0.21
inches below normal and 94% of normal. Precipitation totals by climate division, West
3.86 inches, Central 3.98 inches, Bluegrass 2.37 inches and East 3.58 inches, which
was -0.22, 0.01, -0.80 and 0.14 inches respectively from normal. By station,
precipitation totals ranged from a low of 1.49 inches at CARBONDALE ASOS to a high of
5.52 inches at MURRAY 1W.
* = Based on preliminary data
Summarized and averaged data for the period 20150201 to 20150228(Last 28 Days)
(Not for Legal purposes. Departure from Norms based on climate divisional Averages)
AIR TEMPERATURE PRECIPITATION ExtremeTemp
STATION MAX DEV MIN DEV AVR DEV TOTAL DEV %NORM HI LO
--------------------------------------------------------------------------------
WEST(CD1) 37 -12 20 -9 28 -11 3.86 -0.22 95 66 -22
CENTRAL(CD2) 37 -11 19 -9 28 -10 3.98 0.01 100 64 -22
BLUEGRASS(CD3) 34 -12 16 -10 25 -11 2.37 -0.80 75 62 -32
EAST(CD4) 37 -12 18 -7 28 -9 3.58 0.14 104 66 -27
--------------------------------------------------------------------------------
STATE 36 -12 18 -9 27 -10 3.45 -0.21 94 66 -32
===
Kentucky Climate Summary
For the Period: January 2015
Near Normal Temperatures and Below Normal Precipitation: *
Dry conditions persisted across the Bluegrass State for the month of January. Over
the course of the period, the Commonwealth averaged just under 2 inches, which was
over 1.5 inches below normal. Based on preliminary data at the Ag Weather Center,
this past month would place in the top 20 driest January's since 1895. The dry
conditions pushed Kentucky to a third straight month of seeing below normal
precipitation. As a result, the US Drought Monitor expanded Moderate Drought into
Central Kentucky, along with nearly 70% of the state now seeing abnormally dry
conditions. In addition, the state had been entrenched in a snow drought for the
winter season. Lexington and Louisville had only seen a trace through mid-January.
Snowfall had been a rare occurrence, but that came to an end on the 23rd and 24th.
Low pressure passed just south and east of the state with a heavy snow band setting
up across Central Kentucky and up into the Bluegrass. One particular swath running
from Elizabethtown to Lexington saw between 4 to 6 inches.
Temperature-wise, after a mild December, an Arctic outbreak early in January gave the
feel that winter had returned. A strong cold front pushed through the area on the
night of the 6th. Winds picked up from the northwest, sending the wind chill below
zero for an extended period of time. High pressure moved overhead on the morning of
the 8th, resulting in the coldest temperatures of the young winter season. Most
everyone saw the mercury drop to either side of zero. In turn, this extremely cold
Arctic air forced the livestock cold stress index into the emergency category. The
good news was that this was the only significant cold air outbreak of the month with
temperatures hovering near to above normal for much of the remainder. In fact,
temperatures rose into the 50s and 60s multiple times over the remainder of January.
Overall, temperatures averaged to around normal for the month.
Temperatures for the period averaged 33 degrees across the state which was near
normal. High temperatures averaged from 42 in the West to 42 in the East.
Departure from normal high temperatures ranged from 1 degree cooler than normal in
the West to 2 degrees cooler than normal in the East. Low temperatures averaged
from 26 degrees in the West to 25 degrees in the East. Departure from normal low
temperature ranged from 1 degree warmer than normal in the West to 2 degrees warmer
than normal in the East. The extreme high temperature for the period was 69 at
WHITESBURG 2NW and the extreme low was -9 at BLACK MOUNTAIN ARC.
Precipitation (liq. equ.) for the period totaled 1.94 inches statewide which was 1.79
inches below normal and 52% of normal. Precipitation totals by climate division, West
2.32 inches, Central 1.74 inches, Bluegrass 1.64 inches and East 2.05 inches, which
was 1.61, 2.25, 1.58 and 1.74 inches below normal. By station, precipitation totals
ranged from a low of 0.87 inches at LOUISVILLE APT to a high of 6.79 inches at
POPLAR BLUFF ASOS.
* = Based on preliminary data
Summarized and averaged data for the period 20150101 to 20150131(Last 31 Days)
(Not for Legal purposes. Departure from Norms based on climate divisional Averages)
AIR TEMPERATURE PRECIPITATION ExtremeTemp
STATION MAX DEV MIN DEV AVR DEV TOTAL DEV %NORM HI LO
--------------------------------------------------------------------------------
WEST(CD1) 42 -1 26 1 34 0 2.32 -1.61 59 64 -4
CENTRAL(CD2) 42 0 25 0 34 1 1.74 -2.25 44 64 -3
BLUEGRASS(CD3) 39 -2 24 1 31 -1 1.64 -1.58 51 65 -4
EAST(CD4) 42 -2 25 2 34 1 2.05 -1.74 54 69 -9
--------------------------------------------------------------------------------
STATE 41 -2 25 1 33 0 1.94 -1.79 52 69 -9
===